Atterberg Limits are the measures of the critical water content of fine-grained soils.
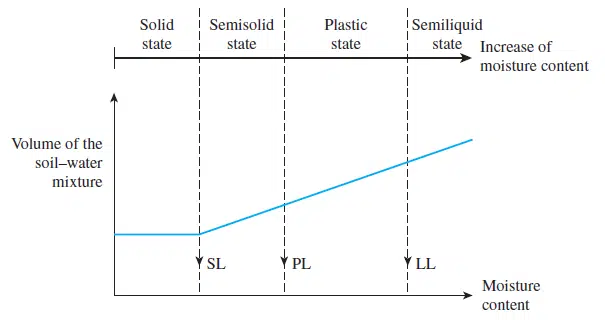
Depending on the water content, fine-grained soil can be categorized into four states of soil. Namely, they are as follows.
- Solid
- Semi-Solid
- Plastic
- Liquid
Changes in between these stages are the Atterberg limits. Namely, they are as follows.
- Shrinkage Limit (SL)
- Plastic Limit (PL)
- Liquid Limit (LL)
Atterberg limits can use to distinguish between different types of silts and clays.
Further, they can use for the classification of soils. Both the soil classification systems, the Unified system, and the AASHTO system use these limits in combination with other parameters to classify the soil.
Let’s discuss the Atterberg limits in detail.
Liquid Limit (LL)
The liquid limit can be defined as follows.
The moisture content, in percentage, at which soil changes from a liquid to a plastic state.
The Liquid Limit is the moisture content at which fine-grained soil no longer flows like a liquid.
The liquid limit is determined by Casagrande’s liquid device.
The moisture content at which it takes 25 drops of the cup to cause the groove to close over a distance of 12.7mm is defined as the liquid limit.
Plastic Limit (PL)
The plastic limit can be defined as follows.
The moisture content, in percentage, at which the soil change from plastic to a semi-solid state.
The plastic limit is the moisture content at which fine-grained soil can no longer be remolded without cracking.
Shrinkage Limit (SL)
The shrinkage limit can be defined as follows.
The moisture content, in percentage, at which soil change from a semisolid to a solid-state.
Shrinkage Limit is the moisture content at which fine-grained soils no longer changes volume upon drying. Any loss of moisture is compensated by the entry of air into the pores.
Why Atterberg Limits Tests are Important
- Soil states(solid, semi-solid, plastic and liquid) have significant differences in strength, consistency and behavior.
- Therefore, knowing the boundaries are very important.
- Classification of soil can be done using these data/ limits.
- Limits can be used to distinguish between silt and clay.
- These parameters can be used in foundation design and geotechnical recommendations.
Plastic Index (PI)
The plastic index is defined as the difference between the liquid limit and the plastic limit.
PI = LL – PL
The plastic index is the measure of the plasticity of the soil. Also, it is the water content soil exhibits the plastic properties. And PI can be used to classify in the following manner too.
- Soil having a high plastic index tend to be clay
- Soil having a low plastic index tend to be silt
- Soil having zero plastic index (PI = 0), tend to be little silt or little clay or no silt or no clay.
| Soil State | Plastic Index (PI) |
| Non-Plastic | 0 |
| Slightly Plastic | < 7 |
| Medium Plastic | 7-17 |
| Highly Plastic | > 17 |
Liquidity Index (LI)
The liquidity index can be defined as the relative consistency of a cohesive soil in the natural stage.
LI = [ ω – PL ] / [ LL – PL ]
Where the ω is the in-situ moisture content of the soil.
Consistency Index (CI)
The consistency index is the indicator of soil consistency or firmness.
CI = [ LL -W ] / [ LL – PL ]
Where the W is the existing water content of the soil.
The following table indicates the variation of the soil Plastic Index and Consistency index.
| Constancy Index (CI) | Liquidity Index (LI) | Consistency of Soil |
| 1.00 – 0.75 | 0.00 – 0.25 | Stiff |
| 0.75 – 0.50 | 0.25 – 0.50 | Medium Soft |
| 0.50 – 0.25 | 0.50 – 0.75 | Soft |
| 0.25 – 0.00 | 0.75 – 1.00 | Very Soft |
In addition to the Atterberg limits, there are other related articles such as soil stabilization and soil types that could be referred to for more information.