A timeline is a sequence or plan of events or activities. It can be in the form of a diagram or chart that shows when something is going to happen and how long it will take. Some people use timelines for project management, for example, to show what needs to be done and by when. This can help the project manager stay on schedule and make sure that all deadlines are met. A Gantt chart is a type of bar chart that shows tasks along the horizontal axis according to their start date and duration along the vertical axis.
These charts can be used in many various ways, and they can be altered in a wide variety of ways as well. The fact that they may be utilized in various professional fields, by people to track their own needs, or by big businesses and organizations to track their biggest initiatives, is even more significant.
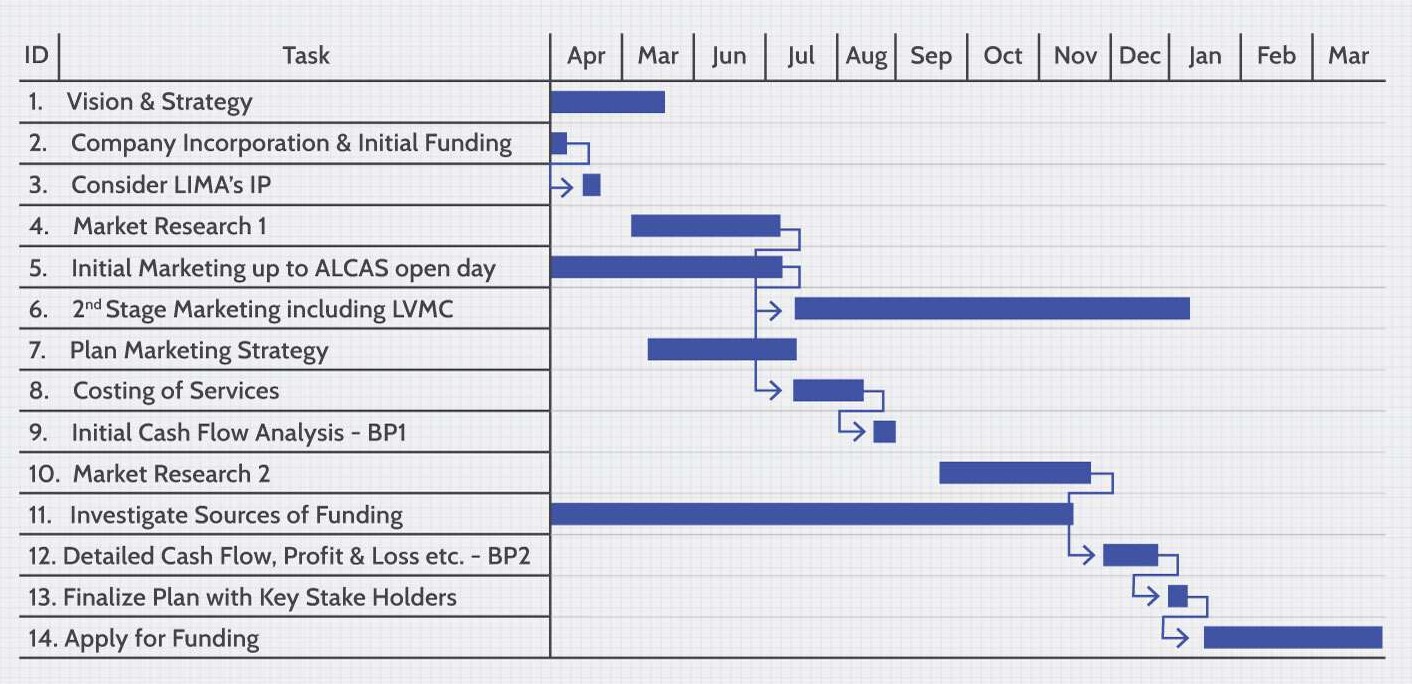
What is a Gantt Chart?
A Gantt Chart is a type of bar chart that shows the tasks or milestones in a project, starting with the start date and finishing with the end date.
The Gantt Chart is an effective way to visualize the duration of a project and its various tasks. It can be used for both small and large projects and is an easy way to manage all tasks promptly. The Gantt Chart can be drawn as a bar graph, with bars as the days of the project, and columns representing different days or sections of time.
Each day’s progress can be summarized by displaying the total number of hours spent on that day. This figure can then be displayed in varying ways depending on how many different times are being compared each day. The three steps involved in using this chart are :
1) choose the tasks to be included in the chart
2) create a time scale from A to Z
3) draw and title the bars and add text information
History of Gantt Chart
Karol Adamiecki, a Polish engineer who supervised steelwork in southern Poland and had developed an interest in management theories and practices, created the first Gantt chart in the middle of the nineteenth century.
Henry Gantt, an American engineer, and project management expert created his version of the chart about 15 years after Adamiecki, and it was this that gained widespread recognition and popularity in western nations. As a result, charts of this kind would come to be known by the name of Henry Gantt.
How to Create a Gantt Chart?
A Gantt chart is a type of bar chart that illustrates a project schedule, typically showing the duration of each task along the x-axis and the start and finish dates of the task on the y-axis. The Gantt chart is named for its inventor, Henry Gantt, who developed it as a tool for large industrial engineering projects such as construction.
Application of Gannt Chart
It is one of the leading project management tools today and it has been developed to connect with many industries as well. The indication provided by the charts and also analysis that can be made with the information obtained from the charts are the key to executing a project successfully.
The main uses of the Gannt Chart are as follows.
- Progress monitoring
- Project Planning
- Source Management
With these uses, the following can be considered as detailed uses of this too.
- Check the information such as information on each task, deadlines, the progress of each task, etc. With that, we can get an idea of the status of the project.
- Good communication tools and evaluation of everyone’s work can be done with the chart. Depending on the observation, work can the planned.
- Resouces allocation and management can be done with the project evaluation. After the initial resource allocations, with the execution of the project, necessary adjustments for the allocated resources in each task can be identified and adjusted.
- The most important aspect of the development of these kinds of charts is to evaluate the project’s progress and accordingly take the necessary decision to complete the project successfully.
- Further, each activity can be evaluated independently, and accordingly necessary decisions can be taken. Once we notice a critical activity that has delayed and affected the overall progress of the project, we attend to it to get it on track.
- We can manage the project even without staying at the project site. If we have the relevant information to upgrade the chart, we can use this tool effectively to provide an update to the project-executing team.
- Since all the information is accessible to the client, engineer, project management team, contractor, etc., and readable, there is no misunderstanding on the project execution.